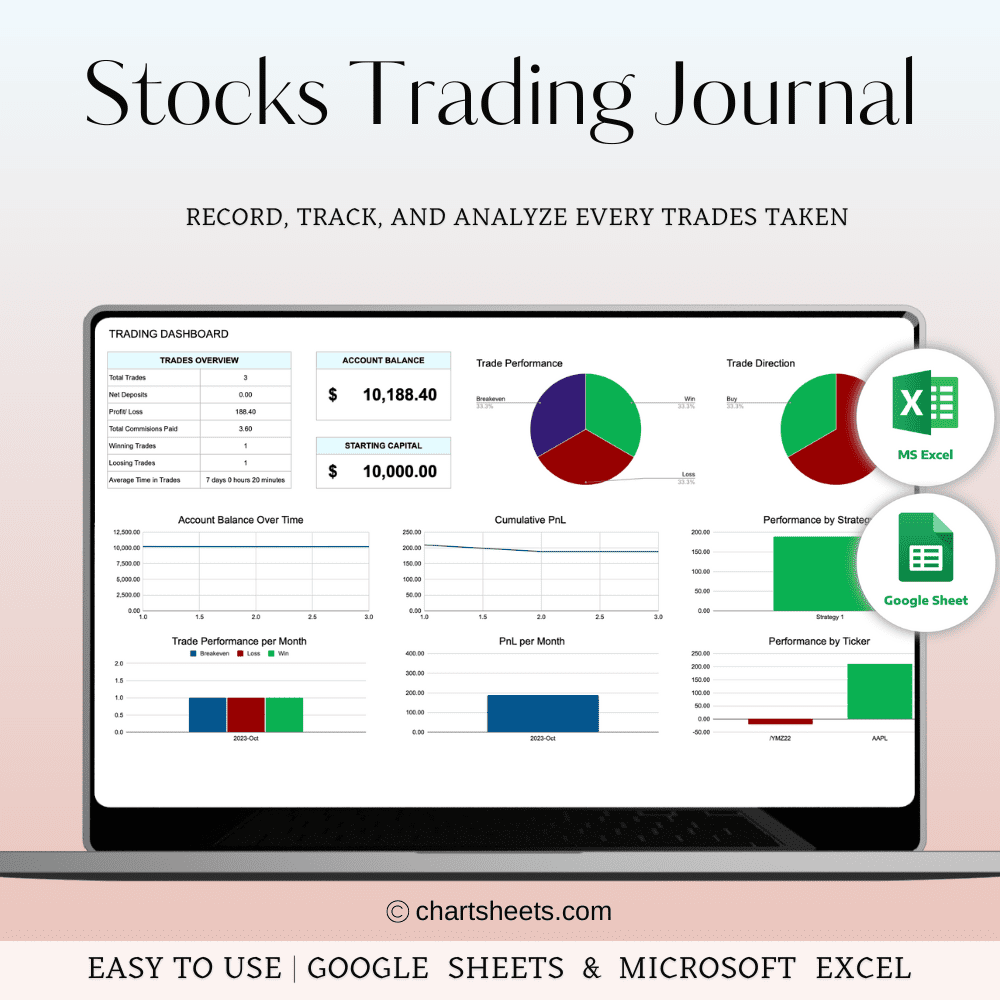
Stocks Trading Journal Template in Excel and Google Sheets
$39.99 Original price was: $39.99.$19.99Current price is: $19.99. 50% Off
Digital download
COUPON CODE
- 40SAVE – Purchase 2 or more items and enjoy 40% off your entire order!
Instant Download
Free Lifetime Updates
Instructions Guide/Video
Stocks Trading Journal Template in Excel and Google Sheets
Make trading easy and efficient with our Stocks Trading Journal Spreadsheet for Excel and Google Sheets! This handy tool allows you to track all your trades in one convenient place, helping you understand what works and what doesn’t in your trading strategy. Whether you’re new to trading or have years of experience, this journal is thoughtfully designed to help you succeed.
The template is incredibly simple to use, with powerful features that let you log your trades, thoroughly analyze your performance, and clearly see your results in visually appealing charts. It’s fully compatible with your computer, tablet, or phone, so you can conveniently manage your trading activities from anywhere at any time. Start your exciting journey to trading success now!
This trading journal features currency options like USD, EUR, GBP, AUD, CAD, CHF, JPY, INR.
WHAT’S INCLUDED?
– Step by step instructions
– 4 Templates of Spreadsheets
– One sample Excel spreadsheet with mock data
– An Excel spreadsheet with empty data
– A sample Google Sheets spreadsheet containing mock data
– A Google Sheets spreadsheet with empty data
– Editable in Google Sheets and Microsoft Excel
– Compatible with MAC, PC, Phones, or Tablets
FEATURES
– Calculates R-Multiple Automatically
– Track Cumulative Profit/Loss
– Charts Show Monthly Performance
– Account Balance Curve
– Win Rate Displayed
– Position Size Calculator
– R-Multiple Profit/Loss
MAIN TRADING DASHBOARD
– Key Performance Trading Analytics
– Trade Performance per Month, incl. PNL
– Trade Direction & Performance
– Account Balance Over Time & Cumulative PNL
WEEKLY DASHBOARD
– Key Performance Trading Analytics
– Risk Management Indicators
– Performance by Trade and Strategy
– Account Balance Over Time & Cumulative PNL
MONTHLY DASHBOARD
– Key Performance Trading Analytics
– Risk Management Indicators
– Performance by Trade and Strategy
– Account Balance Over Time & Cumulative PNL
Learn More
- Step-by-step instructions: Watch on YouTube
- Follow us on social media for updates and promotions! Pinterest | Facebook | Instagram
- Explore our PLR Stocks Trading Journal with resell rights.
- Visit our Custom Spreadsheets page for tailored options.
YOU WILL NEED:
- A device to access Google Sheets or Microsoft Excel
- A Google Account (if using Google Sheets)
- Microsoft Excel software (if using Excel)
- Basic computer skills
HOW IT WORKS:
1. Purchase and download instantly.
2. Open the PDF file to access the Google Sheet link.
3. Download the Excel template.
4. Open the spreadsheet and start planning!
IMPORTANT TO KNOW:
- This is a digital download; no physical items will be shipped.
- Due to the nature of digital products, all sales are final, and refunds are not available.
COLOR DISCLAIMER:
Please note that colors in the spreadsheet may vary slightly due to screen display differences on your device. This can include variations in color on phones, tablets, and computers.
Note: For the best experience, we recommend using a desktop or laptop for full editing capabilities.
NEED HELP? If you have any questions, feel free to reach out to us at [email protected] or [email protected]. You can also contact us on WhatsApp for assistance.
Needed this to track my trades. This is a great journal
la tablbleau de bord est bon dans l'ensemble
Great product, will be using very soon.
Good.. I realy liked it
Very great product would recommend


